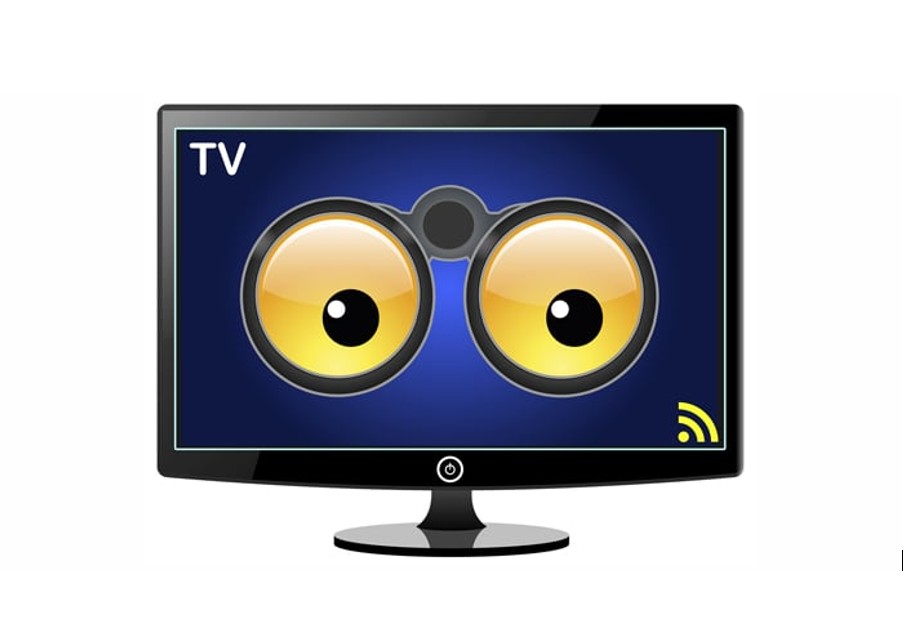
We watch smart TV without necessarily realising that it is watching us. New research from Samba reveals just how much information is being hoovered up and monetised.
Oh. You read and understood the 40,000-word nested privacy policies and terms of use that momentarily popped up as you set up your big-screen smart TV? As if, because the TV will only work on Free-to-Air (FTA or Linear TV) if you don’t accept those terms.
Last year, we wrote about Smart TVs sucking up your viewing data – and more so, we won’t repeat that (but you should read it first), but know this. It collects in granular detail from the profile logged in for both FTA and streaming:
- User name
- Email address
- Physical address (reverse IP Lookup)
- Potentially date of birth
- Streaming services
- What you watch and at what time
- What you search for
- If voice-activated, Google, Alexa and Siri share data
- If/when you pause/resume watching (bored or off to the toilet)
- If you binge-watch
- If you complete a series
- What genres you like (deduced from what you watch)
- Use patterns, e.g. Watch the Chase, followed by 7 News and then onto Streaming
- FTA use versus Streaming use
- What content you may consume via a set-top box, DVD, Blu-ray or streaming dongle, which could include porn, gambling, or Sunday church services.
- Brand of soundbar and any connected accessories
- Content of any USB inserted, including audio and video files
- Data collected from collaborating apps (if you log in with Google, Facebook, etc.)
- Some TVs have cameras and mics and can analyse who is using the set.
Why?
TV makers are getting very greedy. Not only do they want to sell you an advertising display device, built they also want to sell your data so you can see more advertisements. Wait until you see advertisements on fridges and IoT devices😮(it’s coming).
These rivers of gold are used for programmatic advertising, where different ads can be served, laser-focused on your audience type. I have seen two identical TVs using the same streaming channel, showing different advertisements at the same time.
Of course, TV makers say it’s just to help recommend content – pigs flying, they are making billions out of your data.
How much money is our data making for the TV maker?
Unsubstantiated media reports indicated that LG webOS received over US$60 billion in TV viewer data sales to ad brokers. It has about 10% of the global TV market and 52.4% of the premium OLED market.
This represents a 75% increase over 2024 in its subscription service and webOS-based advertising and content business. It is expanding these services to India, Singapore and Hong Kong, following successful launches in Malaysia, Thailand and Taiwan.
Samsung Ads (Tizen OS) does not disclose its data monetisation revenue. Still, as the world’s largest TV maker (and 3.6 million sets in Australia and a 28.3% global market share), it must surpass LG. It has determined that 41% of content is duplicated across FTA and streaming, and developed ‘optimal reach’ to ensure ad dollars are not wasted on duplication. It has found that 66% of Smart TV users – and more than 75% of younger users – use their TV for social media, and internet-based video on apps like YouTube and Twitch.
TCL (Google TV) claims about 14% market share. TCL now claims it has #2 global market share and is #1 in Mini-LED and Google TV with a 28.8% share. Google gets the data and TCL gets a cut.
Hisense also claims 14% global market share. Hinsense owns VIDAA, a cloud-based OS, that has even more potential for two-way communication.
Samba – not the Brazilian dance
Most TVs have a little Samba ACR chip in them as well. Samba is a global leader in AI-driven media intelligence powered by first-party data from millions of ‘opted-in’ (did not read the terms) connected televisions and billions of web signals across more than 50 countries. It gathers viewership data via its proprietary Automatic Content Recognition (ACR) integrated at the chipset level across 24 of the top Smart TVs sold in more than 100 countries globally and captures all content that crosses the TV screen, regardless of source.
Here are a few Samba 2025 stats that may interest
US/UK viewers now spend an average of 60% streaming only and 40% a mix of streaming and FTA – the latter is rapidly declining as FTA channels push users to their digital channels, where they can gather far more information. Streaming is fast becoming the default over as ‘appointment TV’ (FTA watch at a certain time).
Percentage of streaming subscriptions (US/UK)
- 17% 1 (23%)
- 35% 2 (42%)
- 52% 3 (58%)
- 49% (43%) and 4+ streaming subscriptions at a time
Percentage of streaming services (similar for US/UK)
- Netflix has almost 100% as the primary service
- Netflix + Prime 78%
- Netflix and Disney+ 52%
- Netflix and Paramount+ 37%
- Netflix and Apple 24%


But 50%+ of users now choose cheaper ad-supported tiers.

What are we watching (US/UK?
- Drama 64% (57%)
- Crime 31% (30%)
- Thriller 22% (26%)
- Docuseries 16% (21%)
- Action 16% (Can a UK heart stand action?)
- Comedy (The US does not appear to have a sense of humour, yet they elected Donald Trump) (15%)
- Movies released on streaming drive 8x more viewership than paid video on demand
- 41% of the content duplicated is duplicated between Streaming and FTA, although not usually at the same time.
- Audiences are now increasingly centred on premium, plot-driven storytelling, creating optimal conditions for brand message reception.
- Shows are being written around subtle brand endorsements reinforced by advertisements (especially Apple).
Netflix plays the long tail game by dominating many niche audiences with a larger slate than its competitors. Meanwhile, HBO Max and Apple TV win by curating prestige content. Disney+ occupies a third lane, with a commanding lead in family entertainment.
What does the information collected mean to advertisers?
More important than ever is that advertisers must reach their desired audience with precision (no wastage), as the streaming and FTA market is extremely fragmented.
It is no longer good enough to advertise within an audience-compatible show (unless you are a betting app or sell sports gear).
87% of the top 100 advertisers increased their TV spend, seizing opportunities to capture market share. It’s a do-or-die market.

For example, Youi’s ad impressions surged dramatically (+215%) and it became the #3 advertiser in AU (up from #13).
ALDI increased ad impressions (+52%) to gain market share. Woolworths lost market share.
Advertisers within non-discretionary categories like Insurance (+59%) and Pharmaceutical & Medical (+48%) saw some of the biggest increases in ad impressions.
This highlights a major efficiency gap in traditional TV advertising, where a huge portion of the budget is spent oversaturating one group while barely reaching the other.
Advertising now means more than just high TV impression volume. It is now a mix of earned media (press releases), positive (paid) online conversation and social media recommendations and sentiment.

McDonald’s stood out in balancing all three, with its nostalgia-driven “Squad Down Under” campaign that united iconic Birdie, Hamburglar, Officer Big Mac, and Grimace characters, ranking as the #1 advertiser based on TV and impressions and #4 based on online sentiment.
You may think you see a lot of ads from Bunnings, but what you really see is a lot of paid co-promotion in-show placements and social media.
Established brand car ads dropped an average of 37% because of the proliferation of Chinese brands wasting too much on shotgun TV approaches.

Ad overload
In Australia half of TV households see 90% of ads, and the other half watch ABC😜.
The top 50% of FTA households were bombarded with an average of 116 ads per day, accounting for a staggering 90% of all TV ad impressions. This extreme overexposure creates ad fatigue and creative burnout, diminishing the impact of campaign spending. Conversely, the bottom 50% of households (a significant and largely untapped audience) saw just 13 ads per day. This highlights a major efficiency gap and a missed opportunity to reach valuable audiences.
Sources (registration required)


Comments